научный
журнал
Срочная публикация научной статьи
+7 995 770 98 40
+7 995 202 54 42
info@journalpro.ru

In Traffic Flow Model with Transition from Disorder to Order

Рубрика: Физико-математические науки
Журнал: «Евразийский Научный Журнал №10 2015» (октябрь 2015)
Количество просмотров статьи: 25855
Показать PDF версию In Traffic Flow Model with Transition from Disorder to Order
Dr. Abdul Salam. A. Al-Khazraj
Fac. of Education – University of Garmian
Kurdistan Region - Iraq
Abstract
Traffic flow is a collection of multiple phases, each of which is realized under different conditions. In this paper, we propose a new technique to investigate the dynamical transitions between them. A type of the control signal has been added to the traffic system at a given site (signal point) of the single lane highway. Under the effect of the control signal, the velocity of the vehicle which passes the signal point will be changed periodically. Our method is tested for the deterministic NaSch traffic model. The simulation results demonstrate that the disorder states in deterministic NaSch traffic model can be suppressed, and the different types of periodic states would occur.
Introduction
Recently, numerous empirical date and numerical simulations have been made in understanding the traffic dynamics. Some complex physical phenomena have been observed in traffic pattern, including the existence of multiple phases, the hysteresis in transitions between the traffic phases and the long survival time of traffic jams.{1'2'3} In generally, the traffic flow state is relative simple for low density values, and is complex for intermediate high-density values{1'2'4}. In the latter case, chaotic phenomena in traffic system have been observed{5}. From practical point of view such complex behavior in traffic system always bring some safety and jam problems, such as the states of vehicles at the intersections in city network. Thus it would be interesting to further study the transition of the traffic flow state from complex to simple.
A complex traffic pattern consists of numerous traffic jams, where the average velocity of vehicles is lower than the minimum possible average velocity in free flow. It has been suggested that at a bottleneck, the transitions between different types of the traffic pattern can be found. In {6} the dynamical transition from the free flow to the choking flow was studied by carrying out a numerical simulation for the mean-field equation. B.S. Kemer presented the results of an empirical study of spatial –temporal traffic patterns at highway bottlenecks{7}.
Some alternative parameterization of the defect (or, disordered) sites in the NaSch model were outlined. Some effects of the static hindrances on vehicular traffic have also been investigated following alternative approaches11101. In this paper, we designate a type of the control signal at a given site of the road and thus control the disorder states in traffic system. In this case, we note that not only the traffic accident can be decreased, but also the capacity of the network can also be improved in city traffic. To our knowledge, this work explicitly shows cellular automata for the first time.
NaSch traffic model
NaSch traffic model is a one - dimensional probalilistic cellular automation model{11} Which is an extension of the ASEP (Asymmetric exclusion proceses). In NaSch traffic model, the road is divided into L cells numbered by i=1,2 L, and the time is discrete.
Each
site can be either empty or occupied by a vehicle with integer
velocity v=0>1....>Vmaz,
where
is the
 maximum velocity. The underlying dynamics of NaSch model is governed
by the updated rules applied at discrete time steps. All sites are
simultaneously updated according to four successive steps.
maximum velocity. The underlying dynamics of NaSch model is governed
by the updated rules applied at discrete time steps. All sites are
simultaneously updated according to four successive steps.
-
Acceleration : Increase
 by 1 if
 .
. -
Slowing down: decrease
to
= d if necessary (d is the number of empty cells in front of the
vehicle.) -
Randomization: decrease
by 1 with randomization probability p if p>0. -
Movement : move vehicle
sites forward.

The random braking probability or the rule (s) for random braking can give rise to a rich variety of physical phenomena in the generalizations and extensions of the NaSch model(12,13). The effects of the different types of quenched randomness which are associated with the vehicles and the road have been investigated. In this case, the motion is characterized by abrupt changes in vehicles velocities, especially, nondeterministic acceleration as well as overreaction while slowing down. This is crucially important for the complex behavior formation of traffic flow.
In
our method, we designate a type of the control signal at a given site
(signal point) of the road. When the vehicle passes the signal point;
the velocity of the vehicle will be changed at the next time step,
i.e.
 and
and
 .
Where
.
Where is a square wave,
|
|
(1) |


a is a parameter which can be adjusted. Explicitly, when the vehicle passes the signal point, the update rules are as follows
1)
Acceleration : increase
by 1 if

2)
Slowing down : decrease
to
= d
if necessary.
3) Disturbing :
-
and

-
decrease
to
= d
if necessary.
4)
Movement : move vehicle
sites forward.
In step (3) a type of the periodic control signal is added to the traffic system. As the time proceeds, under the effect of the control signal, the velocity of the vehicle which passes the signal point will be disturbed. Since flux is equal to the inverse of the average time-headway, much more detailed information is contained in the distribution of the time headway such as the temporal organization of the vehicles. In the view of time series, the character of the overall dynamics of the systems is reflected in the behavior of any dynamics variable. Here we are mainly focused on dynamical behavior by analyzing the traffic series of the time headways, but for comparison the traffic series of the distance headway is also considered.
There
are N vehicles moving on a road of L sites. The signal point is
designed at
the
middle of the road. A given site of the road is taken as the
observation point.
When
the control signal is added to the system. We start to record the
time that
the
vehicles occupy the observation point. We use ti
to represent the time that ith
vehicle occupies the observation point. The traffic series {xi},
i = 1,…,
K, is recorded as the time-headways at the observation point,
xi=ti+l-ti,.
The investigations are mainly focused on
 =
5, and the boundary condition for NaSch
traffic model is periodic. In this paper a system of L = 400 is
considered.
The
length of the observation time is T=1000, and the first 500 are
discarded to
avoid transistent.
=
5, and the boundary condition for NaSch
traffic model is periodic. In this paper a system of L = 400 is
considered.
The
length of the observation time is T=1000, and the first 500 are
discarded to
avoid transistent.
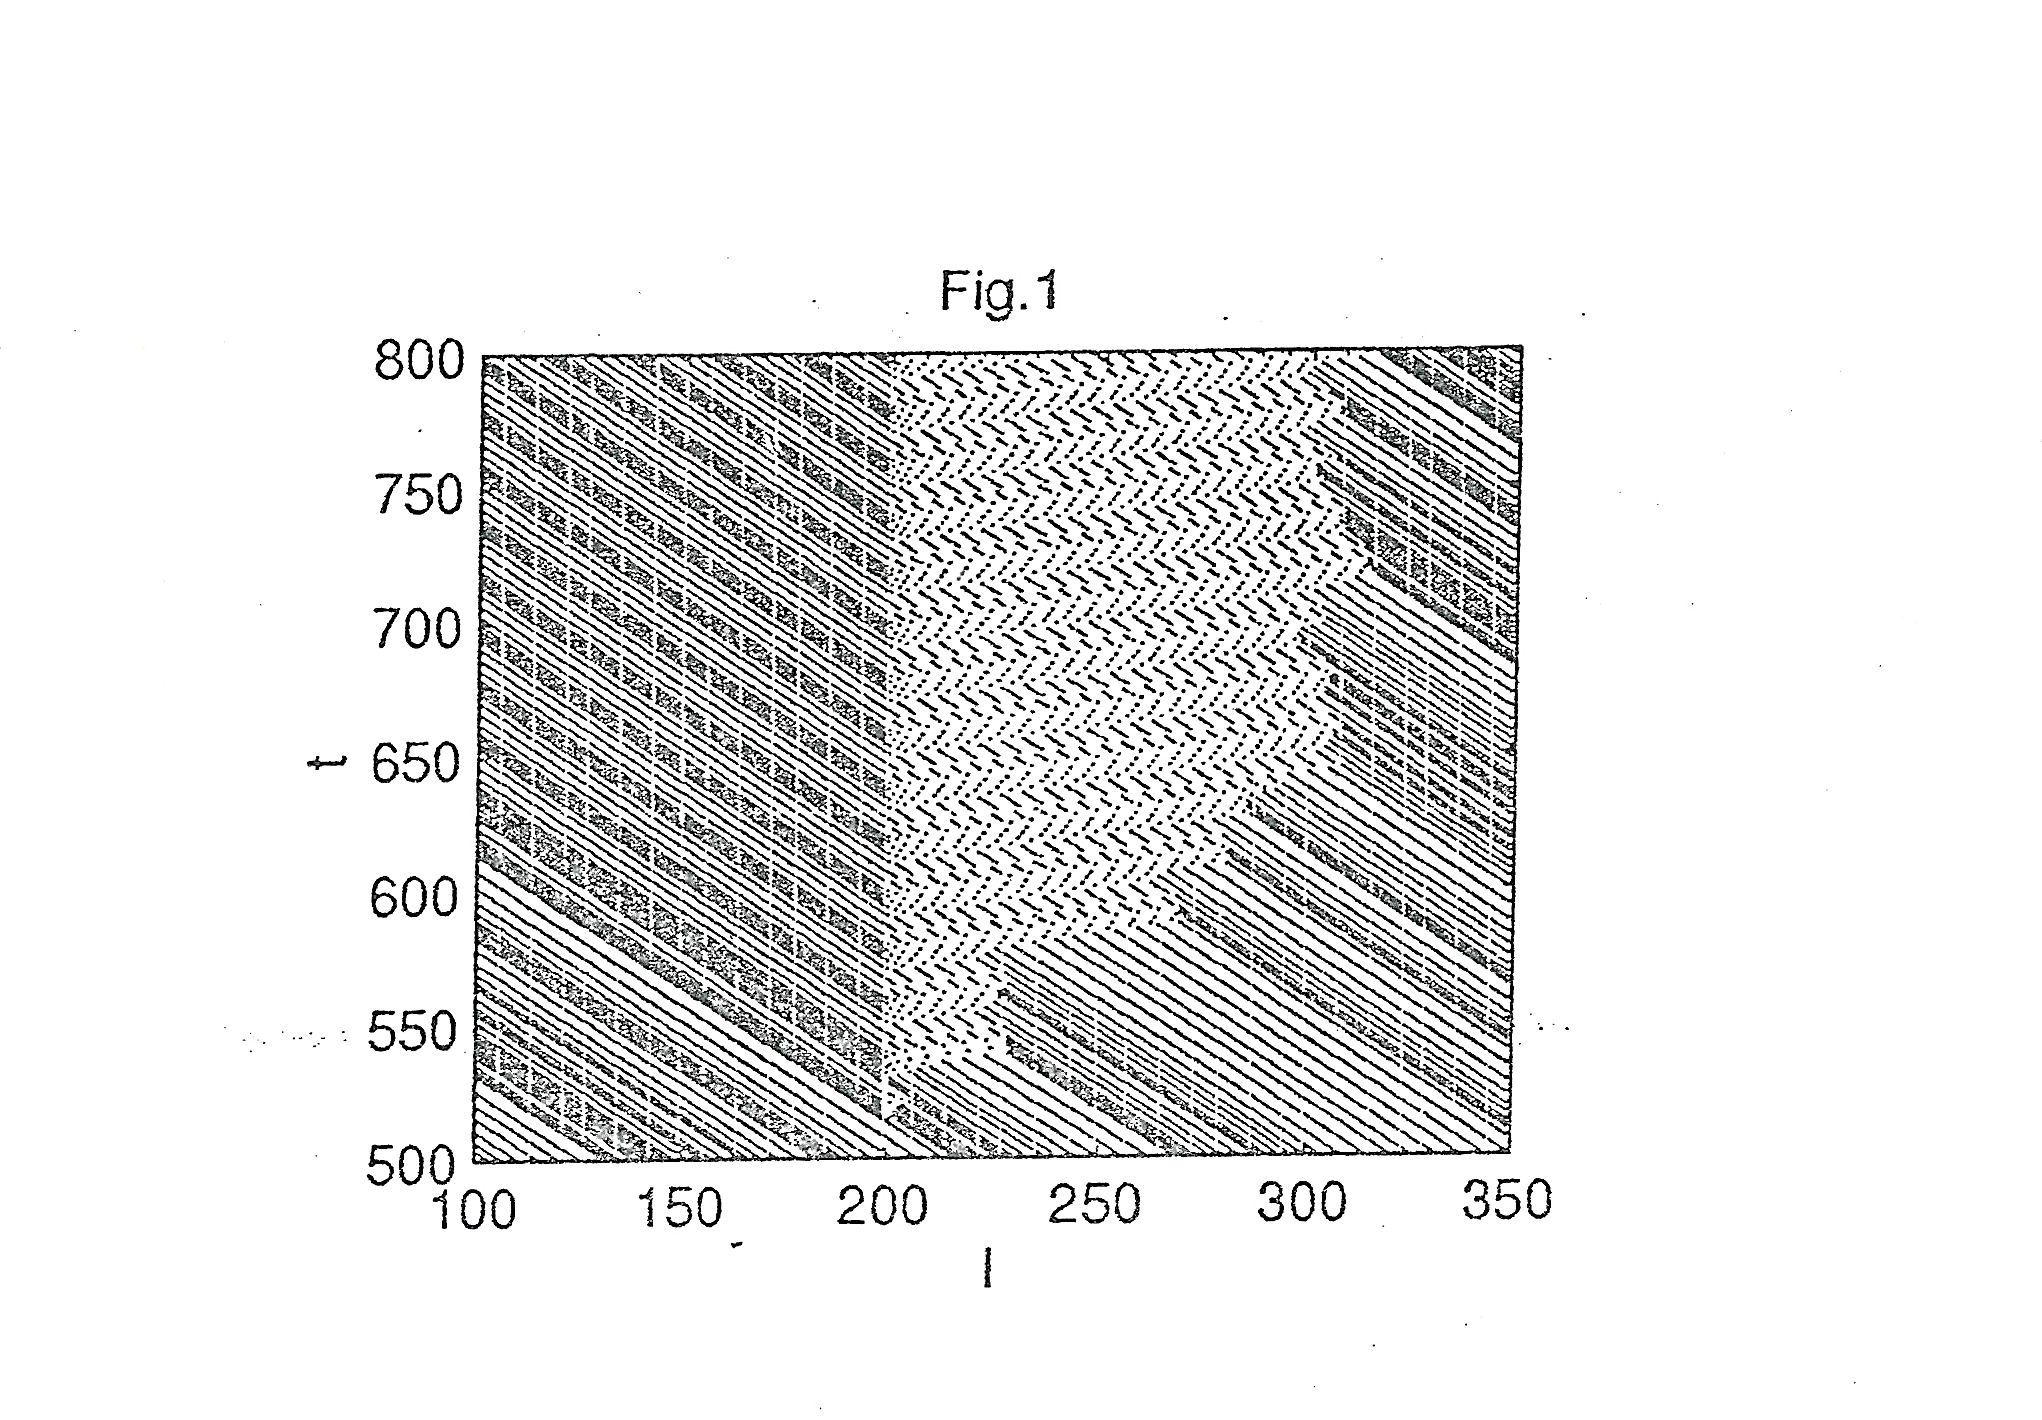
While the vehicle passes the signal point, it is disturbed by the control signal. The local space –time diagram of the traffic flow is shown in fig. 1. In fig. 1 the control signal is added to the traffic system at the time t = 500. from fig. 1 we can observe that the space-time diagram consists of the macroscopic jam and the macroscopic free-flow region, and the homogeneous states of the traffic flow have a lifetime after which their decay leads to a phase separated state. The results indicate that under the effect of the control signal the traffic flow exhibits the macroscopic space-time diagrams into different types of the pattern over time.
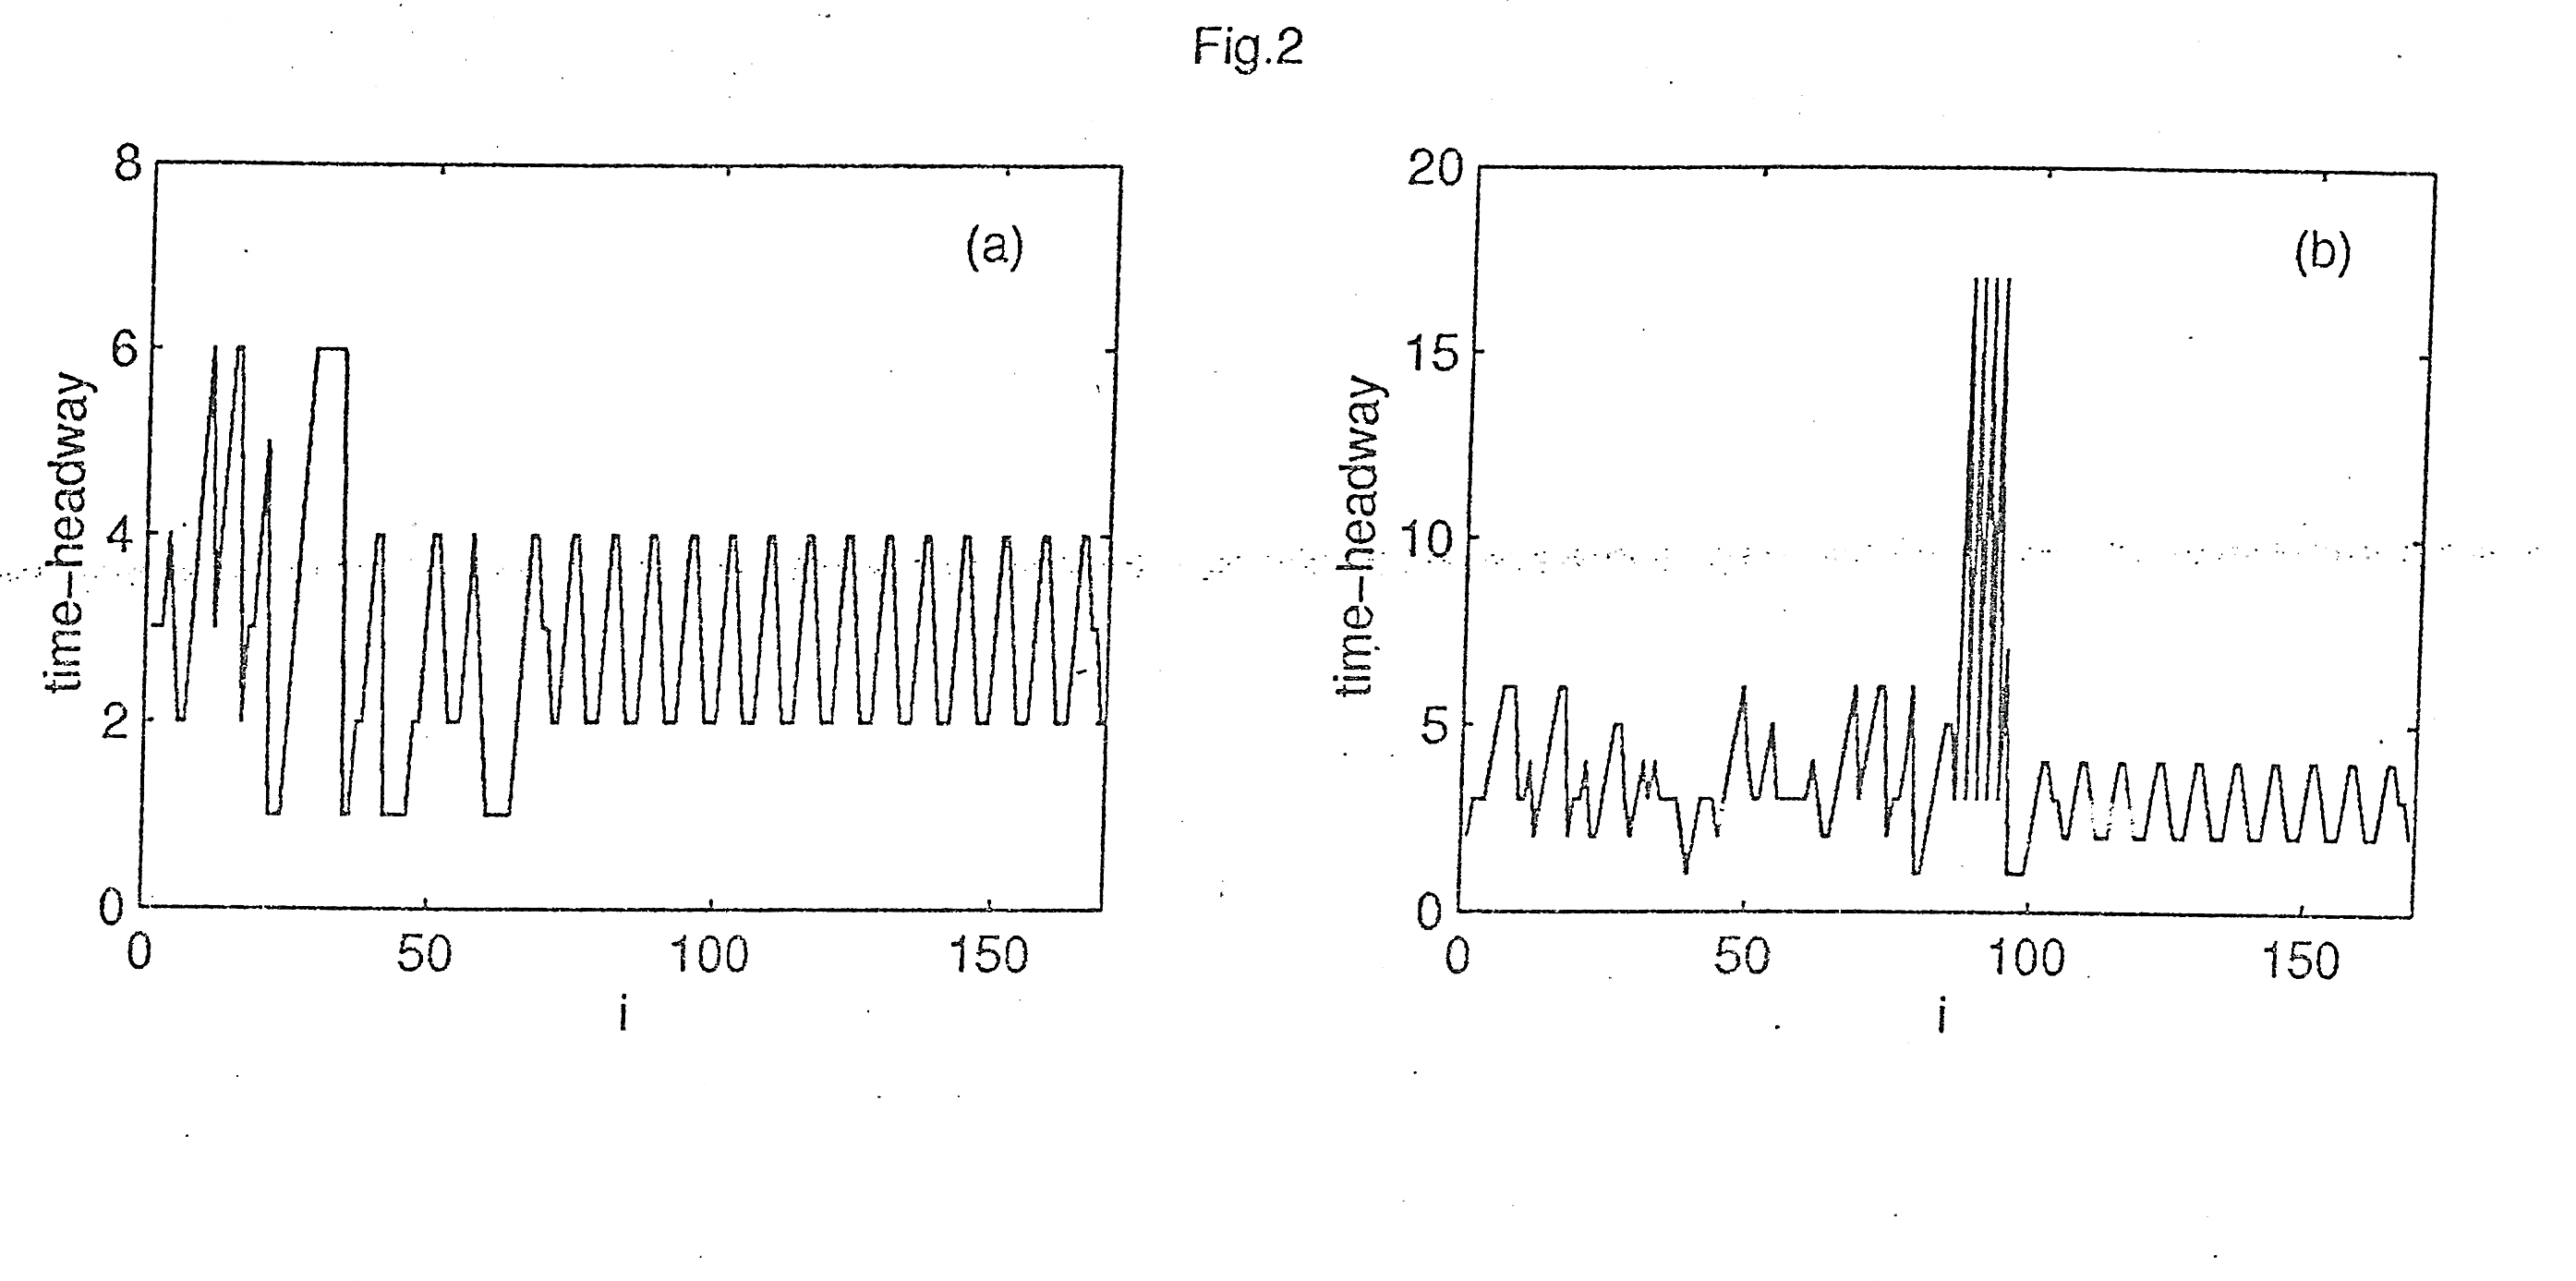
The traffic series of the time headway for the density p = 0.3 is shown in Fig 2. In Fig 2 (a) and (b), we can clearly see that the dynamical states of the traffic flow are disorder at first, and then the traffic flow transit from the disorder states to periodic states with different amplitudes, A part from these we can observe that not only the amplitude of the periodic motion varies with the observation time, but also it varies with the observation site. The simulation results demonstrate that the localized control methods proposed in our method has global effects whereby the states of the traffic flow can be transited form disorder to order.
In
order to get information on the spatial organization of the vehicles
one
can measure the variation of the distance headway on the road. The
traffic
series
 is recorded as the distance headway at a given time t, where
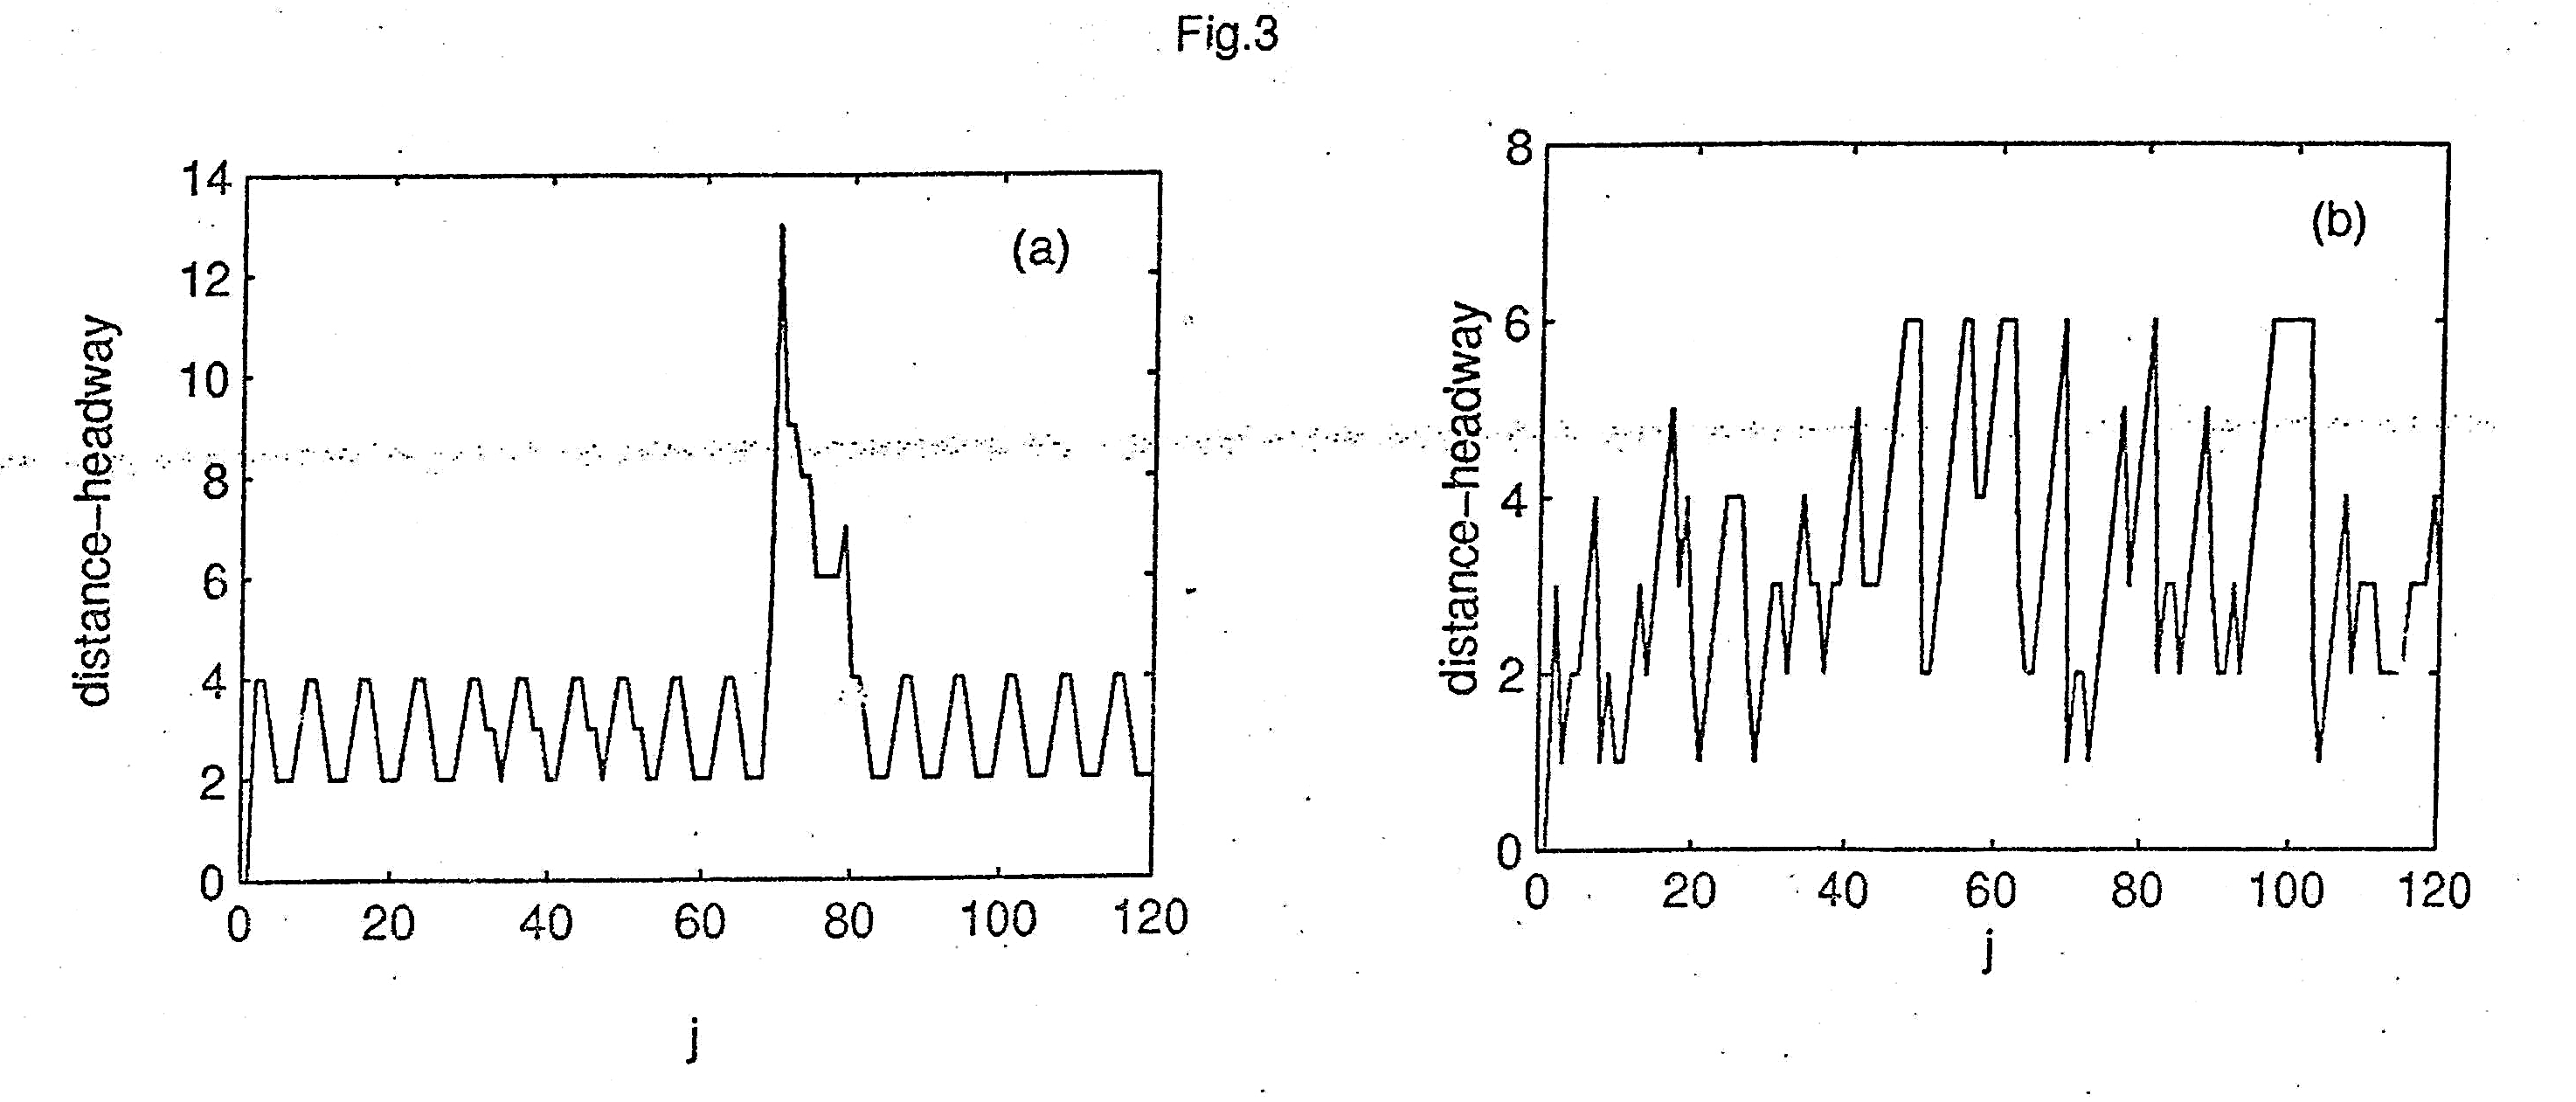
 is the distance from the j-th vehicle to (j+1) –th vehicle. Fig 3
shows the traffic series of the distance headway time t = 1000. Here
the abscissa represents the vehicle on the road, and the parameter a
is set to 10 in Fig 3(a). From Fig 3(a) it can be clearly observed
that the traffic series of the distance – headway is periodic i.e.
the traffic flow is at order state under the effect of the control
signal. However in Fig 3(b), we find that the variation of the
traffic series
of the distance headway is disorder. The results mean that the
traffic flow
can be transited from the disorder state to the periodic state by the
control signal.
is the distance from the j-th vehicle to (j+1) –th vehicle. Fig 3
shows the traffic series of the distance headway time t = 1000. Here
the abscissa represents the vehicle on the road, and the parameter a
is set to 10 in Fig 3(a). From Fig 3(a) it can be clearly observed
that the traffic series of the distance – headway is periodic i.e.
the traffic flow is at order state under the effect of the control
signal. However in Fig 3(b), we find that the variation of the
traffic series
of the distance headway is disorder. The results mean that the
traffic flow
can be transited from the disorder state to the periodic state by the
control signal.
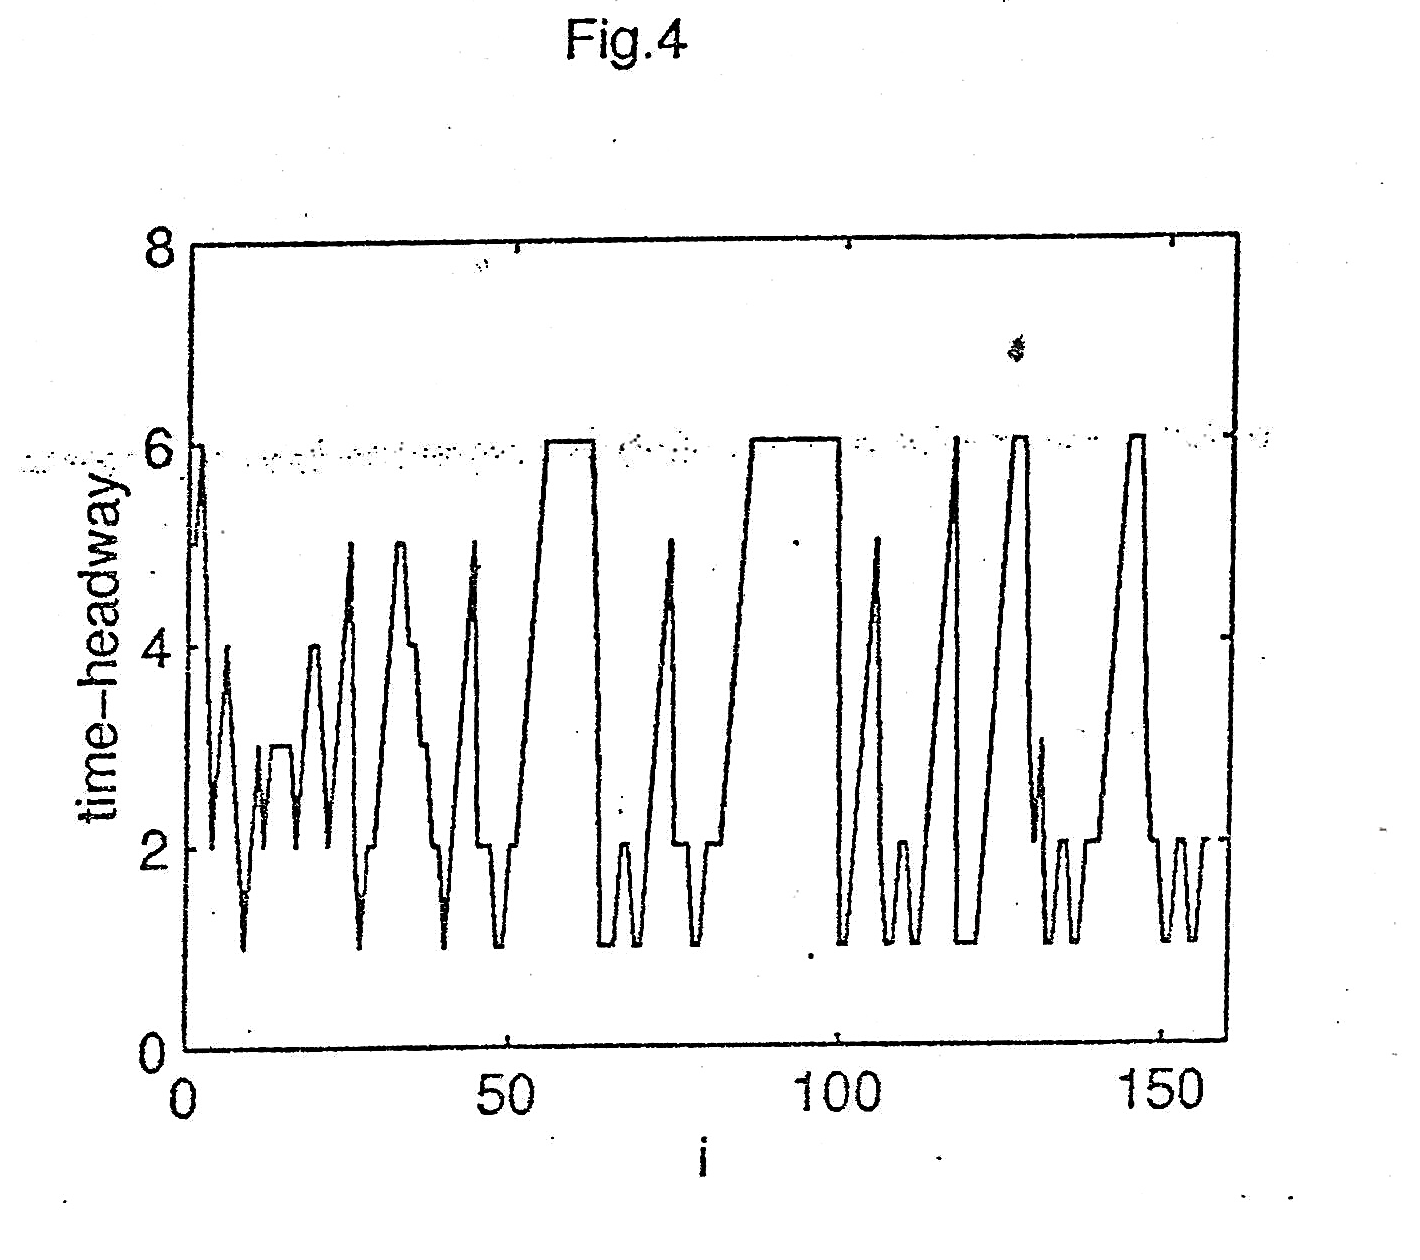
In our method a is an adjustable parameter. If we change the value of the parameter a, the periodicity of the square wave will be changed. Fig 4 shows the traffic series of the time headway for p = 0.3 and a = 15. Comparing Fig 4 with Fig 2(a), it is clearly found that the variation of the time headway in Fig 4 is random as the time proceeds, however, the variation of the time headway is periodic after the sufficient transient time in Fig. 2 (a)
The simulation results demonstrate that only by we choose a suitable parameter a, the traffic flow state can be transited from disorder to order.
Conclusion
In conclusions, the effect of the control signal can be considered as external disturbing. It suppresses the disorder state in traffic flow, and forms the periodic state with different amplitude. On the other hand, our simulations indicate that the traffic flow state in the deterministic NaSch model is sensitive to the fluctuation of the velocity, and therefore is metastable. While the external disturbing is added to the system, the system moves from the metastable state to the stable state.
In
this paper, one of the conditions that the disturbing can be
introduced is
 .
This means that the disturbing does not exist as
.
This means that the disturbing does not exist as
 .
In fact, if the condition that the disturbing can be introduced in
.
In fact, if the condition that the disturbing can be introduced in
 ,
all vehicles in traffic system will be at motionless etc. This is
insignificant. In the other word, if the condition that the
disturbing can be introduced
includes d =
,
the velocity of the vehicles may be is larger than
the maximum velocity
.
This is not permissible in the NaSch traffic model.
,
all vehicles in traffic system will be at motionless etc. This is
insignificant. In the other word, if the condition that the
disturbing can be introduced
includes d =
,
the velocity of the vehicles may be is larger than
the maximum velocity
.
This is not permissible in the NaSch traffic model.
References
-
Kemer B S and Rehborn H 1996 Phys. Rev. E 53 R 4275
-
Kemer B S and Rehborn H 1997 Phys. Rev. Lett 79 4030
-
Elad Tomer, Leonid Safonov and Shlomo Havlin 2000 Phys. Rev Lett. 84 382
-
Kemer B S 1999 Phys. World 12 25
-
Nagatani T 1999 Phys. Rev. E 60 1535
-
Nagatani T 2001 Physcia A 300 558
-
Kemer B S 2002 Phys. Rev. E 65 046138
-
Csahok Z and Vicsek T 1994 J. Phys. A 27 L 591
-
Emmerich H and Rank e 1995 Physica A 216 435
-
Nagatani T 1997 J. Phys. Soc. Japan 66 1928
-
Nagel K and Schreckenberg M 1992 J. Phys. I 2 2221
-
Nagel K and Paczuski M 1995 Phys Rev E 51 2909
-
Benjamin S C, Johnson N F and Hui P M 1996 J. Phys. A 29 3119
Figure
Figure 1 The local space time diagram of the traffic flow for p = 0.3, a = 10 Figure 2 The traffic series of the time headway for p = 0.3, a = 10, Part (a) is obtained at 1 = 100, and part (b) is obtained at 1 = 300 (b)
Figure 3 The traffic series of the distance headway obtained at the time t = 1000 for p=0.3,
Part (a) is with control signal, and part (b) is without control signal
Figure
4 The traffic series of the time headway obtained at the observation
site 1
= 100 for p = 0.3, a = 15