научный
журнал
Срочная публикация научной статьи
+7 995 770 98 40
+7 995 202 54 42
info@journalpro.ru

Building a system of key performance indicators (KPI) in the management of companies specializing in packaging manufacturing

Рубрика: Социологические науки
Журнал: «Евразийский Научный Журнал №4 2026» (апрель, 2026)
Количество просмотров статьи: 294
Показать PDF версию Building a system of key performance indicators (KPI) in the management of companies specializing in packaging manufacturing
Akmal Gaybulloev
Director, Termo Plenka Kaps LLC,
Tashkent, Uzbekistan
Abstract. The article substantiates the need to develop a comprehensive system of key performance indicators (KPIs) for managing companies specializing in packaging manufacturing within a competitive and resource-constrained market environment. It outlines the theoretical foundations of KPI system formation in production organizations, including a hierarchical approach, a balanced structure of indicators, and the principles of their integration into management systems. Industry-specific characteristics of packaging manufacturing as a management object are analyzed, determining the priority of indicators related to equipment productivity, quality, logistics, and sustainability. The author proposes a methodological approach to KPI calculation across functional blocks using normalization, weighting coefficients, and an integrated performance indicator. It is demonstrated that, in the long term, the implementation of a structured KPI system enhances process transparency, supports more informed decision-making, and improves the effectiveness of operational improvement programs.
Keywords: KPI; packaging manufacturing; packaging production efficiency; balanced scorecard; composite performance indicator; operational improvements; sustainability in the packaging industry.
Packaging manufacturing in modern industry occupies the position of a supporting service whose activities are aimed at servicing product markets; at the same time, it represents an independent object of management, as it creates consumer value by ensuring product integrity and safety, logistical suitability (transportation, warehousing, and filling/packing), supports marketing differentiation, and concentrates a significant share of material and energy costs. In practice, packaging enterprises often operate under conditions of high variability in orders (run sizes, materials, design, and industry-specific requirements), sensitivity to raw material prices (paper, cardboard, polymers, inks, and adhesives), constraints in production resources (machine time, personnel, and storage capacity), as well as increasingly stringent requirements for delivery timelines and print/conversion quality. The combination of these factors intensifies the need for continuous measurement of performance and efficiency, i.e., for the development of a system of key performance indicators (hereinafter referred to as KPIs), which is necessary to ensure the alignment of objectives, processes, and outcomes at the level of workshops, production lines, shifts, and the enterprise as a whole.
The relevance of implementing KPIs in packaging manufacturing is driven by the simultaneous impact of competitive pressures and resource constraints. First, the implementation of price-competition strategies for standardized packaging solutions requires systematic monitoring and control of costs, productivity, and losses. Second, increasing demand for customized packaging and shorter product life cycles intensify the need to ensure rapid changeovers and equipment reliability. Third, the shift in demand toward environmentally friendly solutions necessitates the incorporation of environmental metrics. In addition to these factors, digitalization (including the use of MES technologies, sensors, machine logs, etc.) exerts further influence by enabling the collection of data on actual operations and facilitating a transition to measurement-based management.
Considering the above, there is a clear need to develop an industry-oriented KPI system comprising financial, operational, quality, customer, human resources, and environmental indicator blocks, integrated into a composite evaluation methodology suitable for ongoing monitoring.
The methodological framework of the study is based on the analysis of scholarly sources in which KPIs are considered as a component of the management system of production organizations, as well as on the synthesis of industry case studies from the packaging sector where indicators were used to identify losses and assess the effects of implemented improvements. The study was conducted in several stages: at the first stage, the theoretical principles of KPIs were systematized, with the formulation of requirements for indicators as a management tool; at the second stage, packaging manufacturing was decomposed into business processes, leading to the identification of a typical process model; at the third stage, KPIs were designed across functional blocks, including the definition of a minimally sufficient set of indicators, calculation formulas, measurement frequency, responsible owners, and data sources; at the fourth stage, a composite performance indicator was developed along with its theoretical and methodological framework.
Thus, in a production organization, KPIs should be considered as a set of quantitatively defined indicators within a performance measurement system that reflect critical success factors, support strategic and operational objectives, and provide a feedback mechanism for continuous improvement.
It is fundamentally important that KPIs represent a selected set of key indicators that are meaningful for management and capable of explaining performance dynamics, as well as guiding decision-making; at the same time, an excessive number of KPI metrics typically reduces focus and the overall manageability of the system.
From the perspective of operations management, the central task is the alignment of KPIs across different levels—from the enterprise’s strategic objectives to shift-level metrics and those of individual production lines—thus justifying a hierarchical approach to KPI design, which implies the classification of indicators into primary, composite, and supporting categories, along with an analysis of their interdependencies. Such a structure makes it possible to eliminate duplication and to construct a causal hierarchy in which changes in supporting metrics influence composite KPIs and, subsequently, the achievement of target outcomes [7].
In practice, two complementary levels of KPI design are distinguished. The first level is strategic, focused on translating objectives and critical success factors into a system of indicators across key dimensions (typically including finance, customers, processes, and development). The second level is process-oriented, based on process mapping and the identification of losses, followed by the development of metrics related to quality, speed, reliability, and cost.
For packaging manufacturing, the integrated application of these levels is advisable, as together they ensure goal alignment and manageability of the order portfolio while simultaneously providing tools for identifying losses in high-speed operations and reducing quality variability.
At the same time, the issue of constructing KPIs as a system remains fundamentally important; in the packaging industry, given its specific characteristics, the application of a modified balanced approach is justified, taking into account the role of packaging within the supply chain. This implies the integration of strategic and operational measurements with an emphasis on mitigating the risks of one-sided financial control [9]. As a result, the KPI system acquires the function of a tool for aligning departments (sales, production, logistics, and quality) around a unified set of meaningful management metrics. In this context, it is important to consider the industry-specific conditions underlying KPI formation.
In particular, packaging manufacturing is characterized by the following features: the simultaneous execution of converting processes and assembly operations, a pronounced dependence of quality on raw material parameters and the precision of equipment setup, as well as the high cost of line downtime. In the industry’s loss structure, time-related and quality-related losses predominate—downtime due to material shortages, extended changeovers, micro-stoppages, defect production, and deviations from schedules caused by planning and logistics issues. Therefore, the KPI system to be developed must be sensitive to time parameters, quality indicators, equipment reliability, and logistical characteristics, while also ensuring their alignment with cost and margin performance.
The scientific literature highlights the effectiveness of KPI-driven improvements in packaging processes; for example, the implementation of lean practices prior to automation led to a 42.9% reduction in cycle time, a decrease in the share of non-value-added operations, workforce reallocation, and the achievement of direct annual economic benefits, made possible through management based on indicators reflecting process speed, labor intensity, and the economic impact of changes [1]. Therefore, an important principle of KPI orientation is the systematic monitoring of equipment changeover indicators, productivity, and losses.
Measuring equipment effectiveness, for example, involves identifying the main sources of losses—particularly speed losses associated with monitoring practices and adherence to operational standards [10]. In this context, for a packaging enterprise, the focus of KPIs should encompass the structure of capacity losses, since even with near-perfect quality, a significant underutilization of equipment potential may occur.
In addition to equipment and processes, industry requirements also encompass the development of reusable packaging and return systems, which necessitate measuring the performance of reverse flows, return rates of packaging, losses due to non-return, unit logistics costs, and environmental impact. In this context, a productive approach is the differentiation between indicators of initiatives and indicators of their impact on economic, environmental, and social outcomes, as well as the linkage between the product level (e.g., comparing single-use and reusable packaging in terms of emission reduction potential) and the system level (e.g., total logistics costs reflecting the feasibility of the system) [2]. Consequently, for packaging companies developing reusable solutions, the KPI system should incorporate both production efficiency and the effectiveness of circular system operations.
Based on the above, a set of theoretical foundations and methodological guidelines for the development of a KPI system is formed (Figure 1).
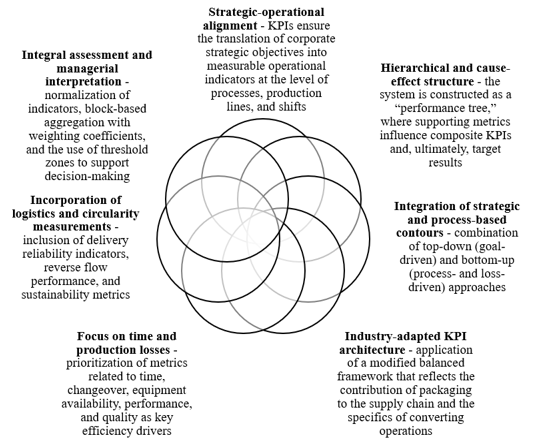
Figure 1. Theoretical and methodological foundations for the development of a KPI system in the management of companies specializing in packaging manufacturing, developed by the author
Building on the presented theoretical and methodological foundations, it is possible to develop a methodological approach (framework) for KPI calculation; the proposed approach is based on the principle of data-driven management, according to which each KPI should be calculated using standardized, regularly recorded process and performance data (production volumes, operating and downtime, quantities of conforming and defective output, material and energy costs, claims statistics, delivery timelines, employee turnover and training, etc.); KPI development is implemented through a KPI passport, the structure of which includes the definition, formula, units of measurement, frequency, owner, data source, normalization rules, and target values; in designing such a passport, it is advisable to rely on the following blocks and indicators (Table 1).
Table 1. Distribution of KPIs across the main blocks
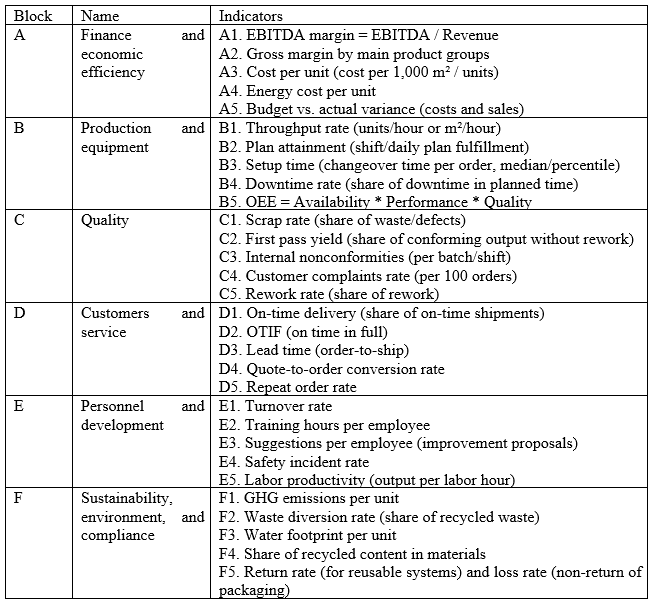
Source: compiled by the author
Based on Table 1, the content validity of the proposed set of KPIs is supported by industry studies, as a pool of 32 KPIs has been identified for packaging companies, grouped into six domains (finance, production, customer satisfaction, quality, employee satisfaction, and environmental protection), with KPI weights determined using the Analytic Hierarchy Process, enabling a transition from a simple list of indicators to a tool for site ranking and decision support [3].
To aggregate heterogeneous indicators, it is necessary to normalize them to a unified scale of
Mode 1 (stimulant): an increase in the value of the indicator reflects an improvement in performance (e.g., OEE, OTIF). Normalization is carried out according to formula (1):
k = (x − xmin) / (xmax − xmin).
Mode 2 (destimulant): a decrease in the value of the indicator reflects an improvement in performance (e.g., scrap rate, downtime). Normalization is performed according to the formula:
k = (xmax − x) / (xmax − xmin).
Mode 3 (target indicator): the optimal value is located near a predefined benchmark (e.g., inventory levels or acceptable defect rates). Normalization is defined by the formula:
k = 1 − |x − xtarget| / Δ,
with k set to 0 if |x − xtarget| exceeds Δ.
The parameters xmin, xmax, xtarget and Δ are determined based on historical data (e.g., distribution quantiles), industry benchmarks, or the company’s technical standards.
At the same time, a key consideration is the aggregation of indicators into a composite performance indicator with the assignment of weighting coefficients. Let Bi denote the aggregated score of the
Σwi = 1.
The composite performance indicator of the enterprise is calculated using the following formula:
IKPI = wA * BA + wB * BB + wC * BC + wD * BD + wE * BE + wF * BF.
Block scores BA, BB, and so on are calculated as the weighted sum of normalized KPIs within the corresponding block (e.g., for Block A, the weighted sum of A1—A5).
To ensure practical applicability, a three-level weighting system is provided:
− strategic weights of the blocks are determined at the level of the board of directors or top management;
− weights of KPIs within each block are established by the heads of functional areas;
− automatic adjustment of weights is possible, taking into account data reliability and completeness in cases where some KPIs exhibit a low level of measurability.
An example of weight distribution for an enterprise focused on margin performance and supply stability is as follows: wA = 0,25; wB = 0,25; wC = 0,15; wD = 0,15; wE = 0,10; wF = 0,10. Under a strategic orientation toward the development of green packaging, the weight of Block F may be increased; such an adjustment should be accompanied by the introduction of circularity and packaging return indicators to ensure the substantive validity of the environmental component.
The interpretation of the composite index results is structured along two dimensions. The first is monitoring, which implies that daily and shift-level indicators (B1—B5, C1—C5, D1, D3) are displayed on MES and/or ERP dashboards; when predefined threshold values are exceeded, an analysis of the causes of deviations is initiated. The second is improvement management, involving weekly and monthly reporting by blocks and the composite indicator IKPI, which are used for project selection, resource reallocation, and the evaluation of the effectiveness of implemented changes.
Practical improvement tools are selected based on the profile of deviations. For example, when a simultaneous decrease in OEE and an increase in downtime are observed, structured loss analysis methods and the DMAIC cycle are applied; studies show that the predominant cause of downtime is material-related factors (84%), with personnel-related factors accounting for a smaller share (15%), which allows corrective actions to be focused on material supply and work organization [8]. When deviations related to changeovers and equipment reliability are identified, the application of SMED and TPM in combination with digital monitoring tools proves effective; in a process improvement model for carton box production, the integration of SMED, TPM, automation, and IoT is proposed to increase OEE, with a gap identified between the current OEE level of 64,27% and the industry benchmark of 72,50%, thereby establishing a quantitatively defined target for the improvement program [5]. In situations requiring rapid impact on the production line, Kaizen and VSM are applied; in a case study of a cardboard manufacturing plant, the use of DMAIC in combination with Kaizen and value stream mapping resulted in a 29% increase in OEE for the finished goods line and a 9% increase for corrugated board production, confirming the effectiveness of KPIs as a tool for measuring improvement outcomes [4]. For enterprises where time losses in routing and waiting predominate, a set of lean tools based on VSM, Kanban, and SMED is effective; for example, in a case study of a labeling and packaging company, a 7,1% reduction in lead time, a 55% decrease in internal nonconformities, and an 83% reduction in customer complaints were achieved, alongside an increase in labor productivity (units per labor hour) and improved actual equipment utilization [6].
In addition, the methodology is based on the principle of single data entry, whereby each primary event (downtime, output volume, batch, defect, claim) is recorded in the source system and subsequently reused in multiple KPI calculations. To support this, a unified reference framework of objects (line, machine, product, order, shift) and events (start, stop, changeover, defect, adjustment) is established. At the data level, quality requirements are defined, including completeness (measured as the share of completed records), accuracy (ensured through range and logic validators), timeliness (measured as the share of records entered within the prescribed time interval), and consistency (expressed as the alignment of downtime cause codes between production units and maintenance services). KPIs calculated using data of insufficient quality are flagged according to their level of reliability and are excluded from incentive systems until data inconsistencies are resolved.
When evaluating KPI results and changes, it is advisable to rely on three key questions (Figure 2):

Figure 2. Questions for evaluating KPI changes, compiled by the author
The procedure for calculating the composite assessment includes a sequence of steps (Figure 3). To ensure the effectiveness of the developed KPI system, a clear allocation of roles is required. At the strategic level, objectives, block weights, and target values are approved. At the functional level, block owners are assigned (finance, production, quality, sales and logistics, personnel, etc.), who are responsible for the accuracy of the methodology and improvement initiatives. At the operational level, data owners are designated (shift supervisors, technicians, quality inspectors), who ensure the timely recording of events.
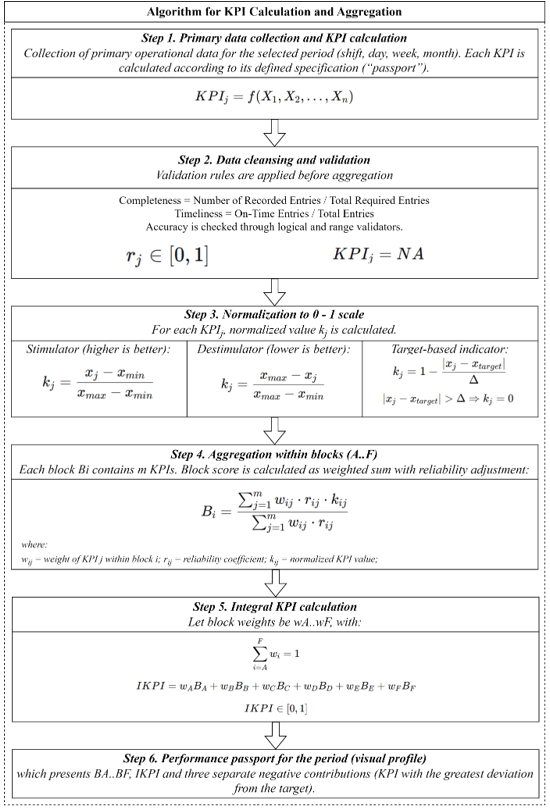
Figure 3. Methodology and procedure for calculating the author’s composite index IKPI, developed by the author
It is important to note that the proposed methodology is intended for companies that
a) have a repeatable set of processes;
b) possess at least a minimal digital infrastructure for data recording;
c) are able to assign responsible owners for performance indicators.
For small-scale production with manual operations, the priority lies in simplifying the set of KPIs and extending the measurement interval (weekly or monthly). For large holdings and complex organizational structures, the methodology can be expanded through benchmarking across sites, the standardization of reference frameworks, and the establishment of a KPI center of excellence.
Thus, the KPI system performs both a control function and a change engineering function, as it enables the quantitative linkage of decisions and changes (rescheduling, changeovers, training, maintenance, automation) with outcomes, thereby reducing uncertainty in decision-making.
References:
1. Alves D., Ferreira L.P., Pereira T., Sá J.C., Silva F.J.G., Fernandes N. Analysis and Improvement of the Packaging Sector of an Industrial Company // Procedia Manufacturing. 2020. Vol. 51. P.
2. Betts K., Gutierrez-Franco E., Ponce-Cueto E. Key Metrics to Measure the Performance and Impact of Reusable Packaging in Circular Supply Chains // Frontiers in Sustainability. 2022. Vol. 3. Art. 910215. DOI: 10.3389/frsus.2022.910215.
3. Cristea C., Cristea M. KPIs for Operational Performance Assessment in Flexible Packaging Industry // Sustainability. 2021. Vol. 13. Art. 3498. DOI: 10.3390/su13063498.
4. Fuad A.M., Takia N.A., Zafir H.A., Farrok O. Enhancing Operational Efficiency through Overall Equipment Efficiency Optimization and Kaizen Initiatives // PLoS One. 2025. Vol. 20, No. 5. Art. e0320761. DOI: 10.1371/journal.pone.0320761.
5. Gonzales-Vera R., Rodriguez-Barrientos K., Castro-Rangel P., Alvarez J.C., Lepore R. Improvement Model of OEE in the Production Process of Cardboard Boxes Through SMED, TPM, Automation, and IoT // SSRG International Journal of Mechanical Engineering. 2025. Vol. 12, No. 6. P.
6. Habib M.A., Rizvan R., Ahmed S. Implementing Lean Manufacturing for Improvement of Operational Performance in a Labeling and Packaging Plant: A Case Study in Bangladesh // Results in Engineering. 2022. Vol. 17. Art. 100818. DOI: 10.1016/j.rineng.2022.100818.
7. Kang N., Zhao C., Li J., Horst J.A. A Hierarchical Structure of Key Performance Indicators for Operation Management and Continuous Improvement in Production Systems // International Journal of Production Research. 2016. Vol. 54, No. 21. P.
8. Mncwango B., Mdunge Z.L. Unraveling the Root Causes of Low Overall Equipment Effectiveness in the Kit Packing Department: A Define—Measure—Analyze—Improve—Control Approach // Processes. 2025. Vol. 13. Art. 757. DOI: 10.3390/pr13030757.
9. Olsmats C., Dominic C.A.s. Packaging Scorecard: A Packaging Performance Evaluation Method // Packaging Technology and Science. 2003. Vol. 16, No. 1. P.
10. Rimawan E., Kholil M., Hendri H. Measurement Value Analysis Overall Equipment Effectiveness Packaging Process in Line 2 (Case Study of PT. MBI Tbk) // IOP Conference Series: Materials Science and Engineering. 2018. Vol. 343. Art. 012021. DOI: 10.1088/1757-899X/343/1/012021.